
Introduction
Although often criticized, risk matrices remain universally used due to their simple yet effective visual representation of potential dangers. The key to their utility, or lack thereof, lies primarily in their design. A poorly designed matrix can misrepresent risks and lead to unnecessary panic or, even worse, overlooking significant hazards. One of the most widely used is the 5×5 matrix, which we will discuss today.
All that follows are just some examples. A 4×4, 6×6, 5×7, or any variation of risk matrix can be perfectly adequate. For our purposes, a 5×5 matrix gives an optimal level of granularity while remaining understandable for non-technical audiences.
Defining the Worst Case Scenario
The first step in creating a robust risk matrix is determining your organization’s worst-case scenario. Consider what matters most to you. It could be the well-being of your people, the security of your information, the safety of your property, the protection of your economic assets, or the maintenance of your reputation. What does a catastrophic existential consequence look like for your organisation. A good starting point is to use the PIPER acronym to think about this in five dimensions:
- People.
- Information.
- Property.
- Economic Assets.
- Reputation & Brand.
You might have other categories that are more aligned with your organisation (e.g.: capability, objectives, product quality). Whatever your categories, it’s important at this stage to think about what an existential consequence would look like for your organisation. What sort of outcomes would likely mean the end of your organisation.
Here are some examples of worst-case scenarios (catastrophic outcomes) for each asset class we’ve listed in the PIPER model.
- People: A catastrophic event involving loss of life on a large scale, such as a major accident at a company event or a widespread health and safety failure, could lead to the closure of an organization. Such a tragedy would have severe legal and financial implications, potentially overwhelming the organization’s resources.. The impact would not only be on the individuals directly affected but also on the morale and mental health of other staff members resulting in cascading downstream consequences. This category also needs to consider the death of essential persons. In a small business, the death of the founder could be an existential risk. Equally, some large organisations prohibit all Board members from flying on the same aircraft at the same time for this very reason.
- Information: A significant data breach involving sensitive information could have disastrous consequences. For instance, if highly classified information, trade secrets, or customer data were stolen and made public, it could lead to massive lawsuits, regulatory fines, and a complete loss of trust from customers and partners. This could financially ruin the organization and make recovery impossible. A historical example of this might be the capture of an Enigma machines by the allies in WW2, an event which contributed significantly to the demise of the Third Reich.
- Property: Complete destruction of key operational sites or assets could lead to an organization’s downfall. Imagine a scenario where a company’s main production plant is destroyed by a natural disaster, and the company doesn’t have adequate insurance or backup facilities. This could halt production indefinitely, leading to insurmountable financial losses and potential bankruptcy. Even if the organisation has adequate insurance, the time taken to replace a critical facility might be too long for the organization to remain viable.
- Economic Assets: A worst-case scenario might involve a severe market downturn or a catastrophic financial decision that results in the complete loss of the organization’s financial assets. For instance, if a company loses a major lawsuit leading to crippling fines or is caught in a substantial investment fraud, it may lead to insolvency, with recovery being unlikely. The key issue to think about here, is what level of financial loss would be beyond your organisation’s ability to recover from. Some examples to think about might be 100% of net worth, two years revenue, > 90% loss of funding support, three years of consecutive losses, etc.
- Reputation & Brand: Severe damage to the organization’s reputation could also be an existential threat. A significant scandal, such as being involved in criminal activities, a serious ethical breach, or a public incident causing considerable harm to the public, could lead to a mass exodus of customers, legal action, and permanent damage to the brand. Once a brand’s reputation is severely damaged, it can be near-impossible to recover. An example could be a significant product safety issue leading to harm for customers and a loss of trust in the brand. A real life example is Arthur Andersen, an American accounting firm that by 2001, had become one of the world’s largest multinational corporations. The firm collapsed by mid-2002, when its questionable accounting practices for energy company Enron and telecommunications company Worldcom were revealed.
These are extreme examples that are unlikely to occur. Ideally, your organisation doesn’t engage in activities which make these outcomes likely. Nevertheless, part of comprehensive risk management is considering and planning for even these worst-case scenarios. Table 2 has some examples of what the various consequences might look like for a hypothetical organisation.
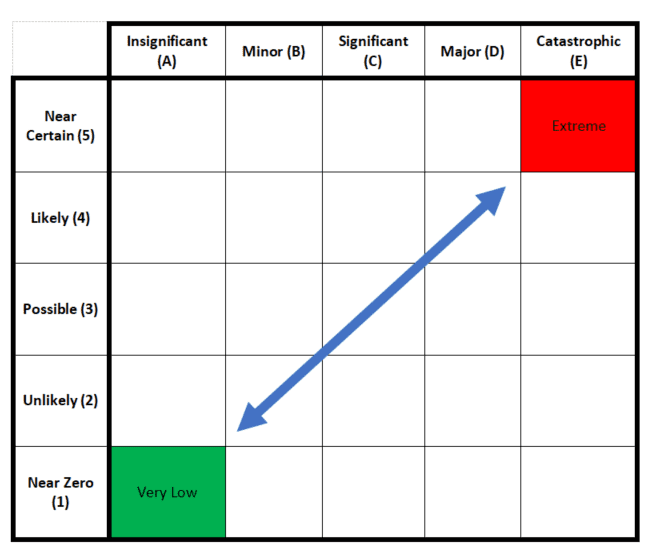
Once you’ve defined your worst case consequences, it is time to consider how you might assess the likelihood of these worst-case scenarios occurring. Do this by considering a range of parameters such as probability, likelihood based on historical data, industry norms, and expert judgment. This worst-case scenario defines the ‘EXTREME’ risk and should be situated in the top-right corner of your matrix, indicating a high consequence and high likelihood.
Probability is the simplest as it is a number from 0 to 1.0 but do you have enough quantitative information to use purely statistical modelling? If not, what would be the cost to research or define quantitative information? Depending on the scale of the risk assessment the cost of acquiring and analysing such data often isn’t warranted. In which case you also need some qualitative likelihood rankings such as historical frequency in other organisations or expert judgment. Table 1 offers some examples of how this might be described so that it can be consistently applied.
Establishing the Near-Zero Risk Level
Once you have identified and placed your worst-case scenarios, focus on establishing the near-zero, or ‘insignificant,’ risk level. These are rare occurrences with minimal consequences – the ‘so what’ minor risks. This category becomes the ‘VERY LOW’ risk rating in your matrix and is located in the bottom-left corner, representing low consequence and low likelihood.
Creating Your Business-As-Usual Risk Threshold
With your extreme and very low risks defined, the challenge now lies in establishing your Business-As-Usual (BAU) or ‘Low’ risk versus your ‘Oh-oh, we need to act now’ or ‘High’ risk. This design step is crucial as most risks will fall within the 2-4 range for both likelihood and consequence, effectively creating a 3×3 matrix in the midsection.
In practice, you should expect most risks to live in this 3×3 central area of a 5×5 risk matrix. Very Low risks are rarely worth recording in a risk register as they are business as usual, managed by routine staff activities. On the other hand, Extreme risks are the sort of risks that a well-managed organization avoids in the first place. Equally, any’ Near-Certain’ risk is generally an ongoing issue rather than a risk.
Most risks are, therefore, likely to involve this central 3×3 area. Of course, there are exceptions to this, however, such as Earthquakes or Terrorist attacks which might be Near-Zero Catastrophic risks. It is always a judgment call regarding what to include in a risk register; however, the context (per ISO31000) will provide typically provide the necessary guidance.
Defining your BAU risks involves a delicate balancing act of categorizing risks that are part of your day-to-day operations versus risks that need immediate attention or change in strategy. Creating a realistic model representing common scenarios your organization faces would be best. For instance, in the ‘Likely’ category (4 on a scale of 5), consider risks that occur frequently but have manageable consequences. In contrast, risks that rarely happen but have disastrous effects if they do should be placed in the ‘Near Certain’ category (5 on a scale of 5).
This classification helps in decision-making and resource allocation. It allows everyone to understand which risks need immediate action, which can be managed with existing resources and standard operating procedures, and which require additional help or strategic planning.
All stakeholders must understand this classification, from the executive management to the operational teams. This way, everyone understands the risk landscape and can act accordingly when faced with potential hazards. One way to do this is illustrated in Table 4: Risk Tolerance.
Now, back to the discussion on achieving the right balance. A risk management specialist, such as the Chief Risk Officer or an equivalent senior risk advisor, can bring their expertise to design your BAU risk thresholds carefully. However, the CEO, executive management or the Board should sign these thresholds to ensure alignment with the overall business strategy and risk appetite.
Conclusion
In summary, the power of a risk matrix lies in its design. A well-crafted matrix effectively communicates risks, providing valuable insights for decision-making. However, a poorly designed matrix can lead to misrepresentation and misunderstanding of risks, which can be disastrous for an organization.
Well-designed risk criteria can take much of the subjectivity out of risk assessment and provide a basis for discussion. There is no perfect definition for risk criteria, so the core objectives are simply:
- Provide a foundation for discussion that leads to a shared understanding.
- Provide an ordinal (semi-quantitative) ranking which can be applied systematically and consistently to compare and prioritise risks.
The key issues with risk matrices usually stem from:
- poor design, which we have discussed here;
- inadequate definitions of risks (risk statements); and,
- insufficient inputs to determine likelihood and consequence.
However, when designed and used correctly, risk matrices are incredibly effective tools for risk management. In this article we looked at the first of these issues. We will look at the latter issues in separate articles so if you would like to be notified when new articles are published, you can sign up for our newsletter.
Examples of Risk Criteria Tables
Now, let’s move to the practical part. Here are four tables you can copy and paste to guide you in creating your risk matrix. Please note, that these are not prescriptive. They are simply examples and would need to be customised for your organisation.
Table 1: Likelihood Criteria
|
Probability |
Likelihood |
Historical Data | Industry Norms |
Expert Judgement |
|
| Near Certain (5) | >0.95 | Regularly | Extensive records of occurrence | Common in industry | Almost certain according to experts |
| Likely (4) | >0.65 | Often | Records of frequent occurrence | Often happens in industry | Likely according to experts |
| Possible (3) | >0.35 | Sometimes | Records of occasional occurrence | Sometimes happens in industry | Possible according to experts |
| Unlikely (2) | >0.05 | Rare | Few records of occurrence | Rarely expected in industry | Unlikely according to experts |
| Near Zero (1) | < 0.05 | Almost never | No records of occurrence | Not expected in industry | Very unlikely according to experts |
You don’t need to use all, or indeed any, of the categories that are used in the table above. Even if you do, your organisation might wish to provide more guidance for the descriptors in this table.
For example the definitions for the five likelihood terms (Column 3) used in this table could be articulated in your risk management framework as follows:
- Regularly: This term refers to events that occur consistently or habitually. In a risk context, “regularly” would imply that the risk event is highly likely to happen, with occurrences expected frequently or at consistent intervals. An example might be everyday operational risks in a business, such as minor IT glitches.
- Often: “Often” describes events that repeatedly occur within a given period, though not as consistently as “regularly.” These events happen with enough frequency to be expected but not so frequent as to be considered routine. For example, an “often” occurrence in a factory setting might be equipment malfunctions that happen several times a month.
- Sometimes: This term describes events that occur occasionally or intermittently. They are not as frequent as “often” but not as rare as “rare.” In a risk context, a “sometimes” risk could be a periodic issue like quarterly budget overruns.
- Rare: “Rare” refers to events that seldom occur. These events are infrequent and not expected to happen regularly or often. An example of a “rare” risk might be a natural disaster affecting a business in a relatively stable geographical area.
- Almost never: This term describes events that rarely occur. They are incredibly infrequent and unexpected, typically referring to possible but highly unlikely events. An “almost never” risk might be something like a meteor strike affecting business operations.
These definitions are subjective and relative to the specific environment or context. Therefore, they should be calibrated according to your organization’s unique circumstances and risk thresholds.
Table 2: Consequences
|
Insignificant (A) |
Minor (B) | Significant (C) | Major (D) |
Catastrophic (E) |
|
| People | Nil or insignificant injury such as paper cuts or minor bruise | Minor injuries requiring first aid | Major injuries requiring medical treatment | Serious injuries leading to hospitalization | Multiple fatalities |
| Information | No loss of data | Minor loss of data, quickly recoverable | Significant loss of data, recoverable with effort | Major loss of data, partially recoverable | Total loss of critical data |
| Property | Minimal or no damage | Minor damage, easily repairable | Significant damage requiring substantial repairs | Major damage requiring extensive repairs | Complete destruction of property |
| Economic Assets | Negligible financial loss | Minor financial loss | Significant financial loss | Major financial loss | Bankruptcy or severe financial loss |
| Reputation | Negligible impact on public image | Minor public image damage, easily recoverable | Significant damage to public image, recoverable with effort | Major damage to public image, long-term impact | Catastrophic damage to public image, company integrity irreparably damaged |
Table 3: Risk Matrix
The internal 3×3 matrix is highlighted purely to indicate the range where you can expect most risks to be plotted. Risks that turn out to be in the ‘Very Low’ category, if they are considered at all during risk analysis, are often likely to be excluded from the risk register. Including all risks in the Very Low category, is in practice, likely to lead to hundreds of risks being recorded on the risk register, for little if any benefit.
Equally, risks which are rated ‘Extreme’, if not identified quickly, are likely to have already ended the existence of your organization. For a startup, this is a sensible area to operate. Many startups will choose to accept a low probability of success with high likelihood of financial failure, on the basis that if they survive their first couple of years, the rewards are commensurate.
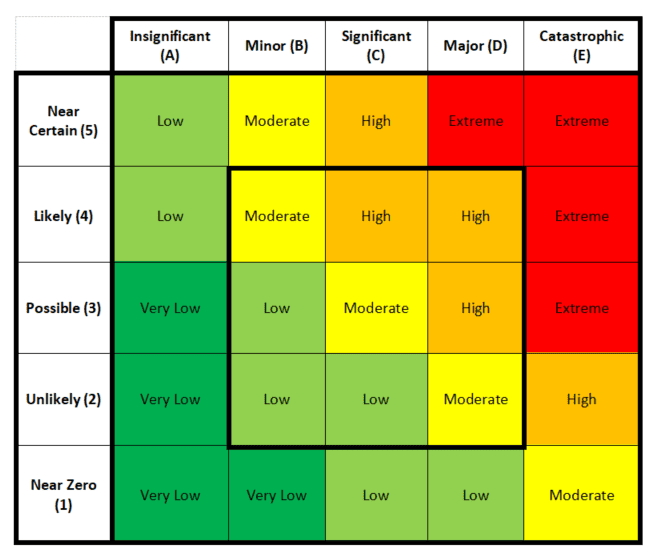
Table 4: Risk Tolerance
| Extreme | Intolerable. Executive management must address this risk within 7 days or cease this activity. |
| High | Intolerable. Senior management must reduce this risk to at least Moderate within 30 days or gain Executive management waiver. |
| Moderate | Tolerable. These risks should be recorded on the risk register. Senior and mid-level management must monitor these risks and reduce them to As Low As Reasonably Practicable (ALARP). |
| Low | Risks should be managed by Frontline managers using routine procedures to reduce them to ALARP. |
| Very Low | Acceptable risks. Managed by routine procedures. |
Looking to take the hassle out of creating your risk matrix? Sign up for a free trial of SECTARA. It’s faster and easier than Excel and helps you create a risk matrix tailored to your organization’s needs.
Click Here for a free trial.